The AI Talent Shift: A 10-Year Roadmap for White-Collar Work

Will AI Wipe Out White-Collar Work? A 10-Year Data-Backed Roadmap
Structural restructuring, not a total wipeout, is what the evidence actually shows — and the damage is manifesting in entry-level hiring funnels years before it appears in aggregate layoff data.
Last updated: February 2026 | Evidence base: BLS, Brookings, Stanford, Yale, Dallas Fed
Executive Research Summary
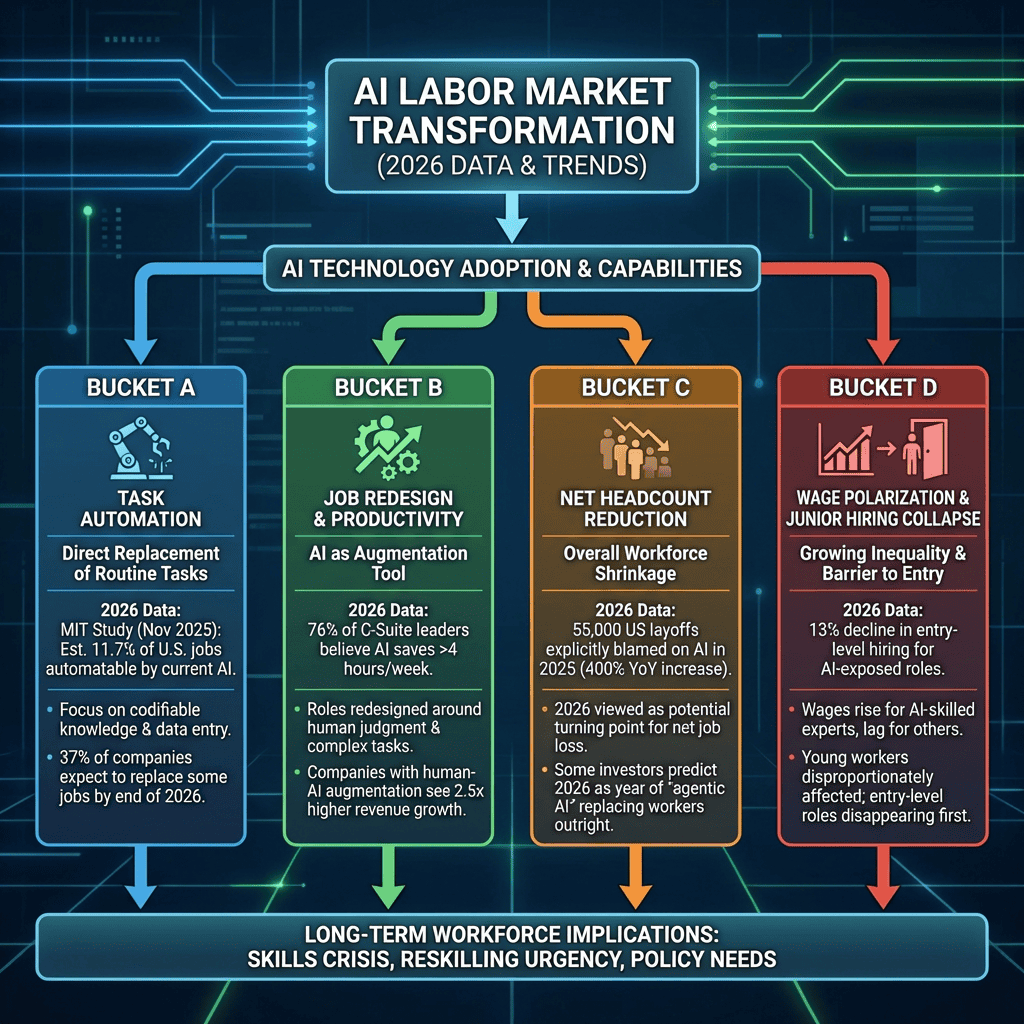
This 2026 analysis by Chuck Price identifies four distinct AI displacement mechanisms:
(A) Task Automation,
(B) Job Redesign with Productivity Lift,
(C) Net Headcount Reduction, and
(D) Wage Polarization.
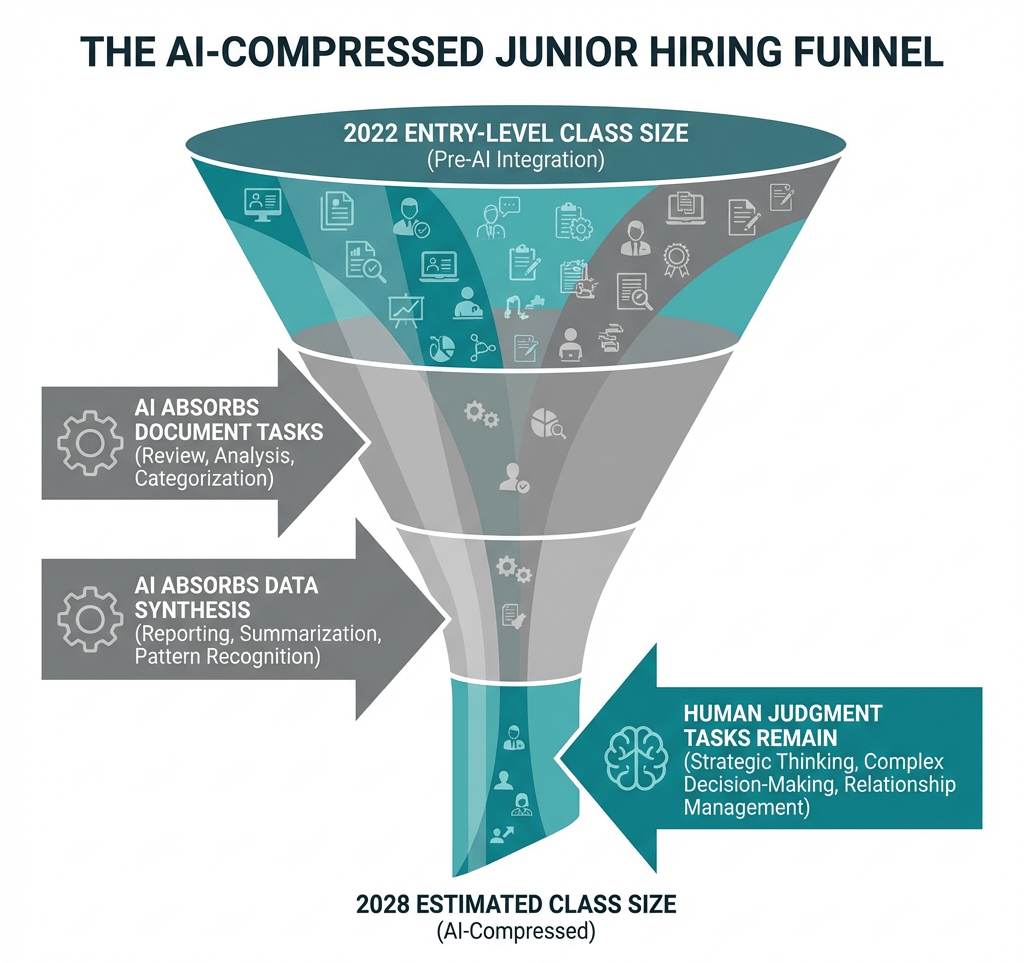
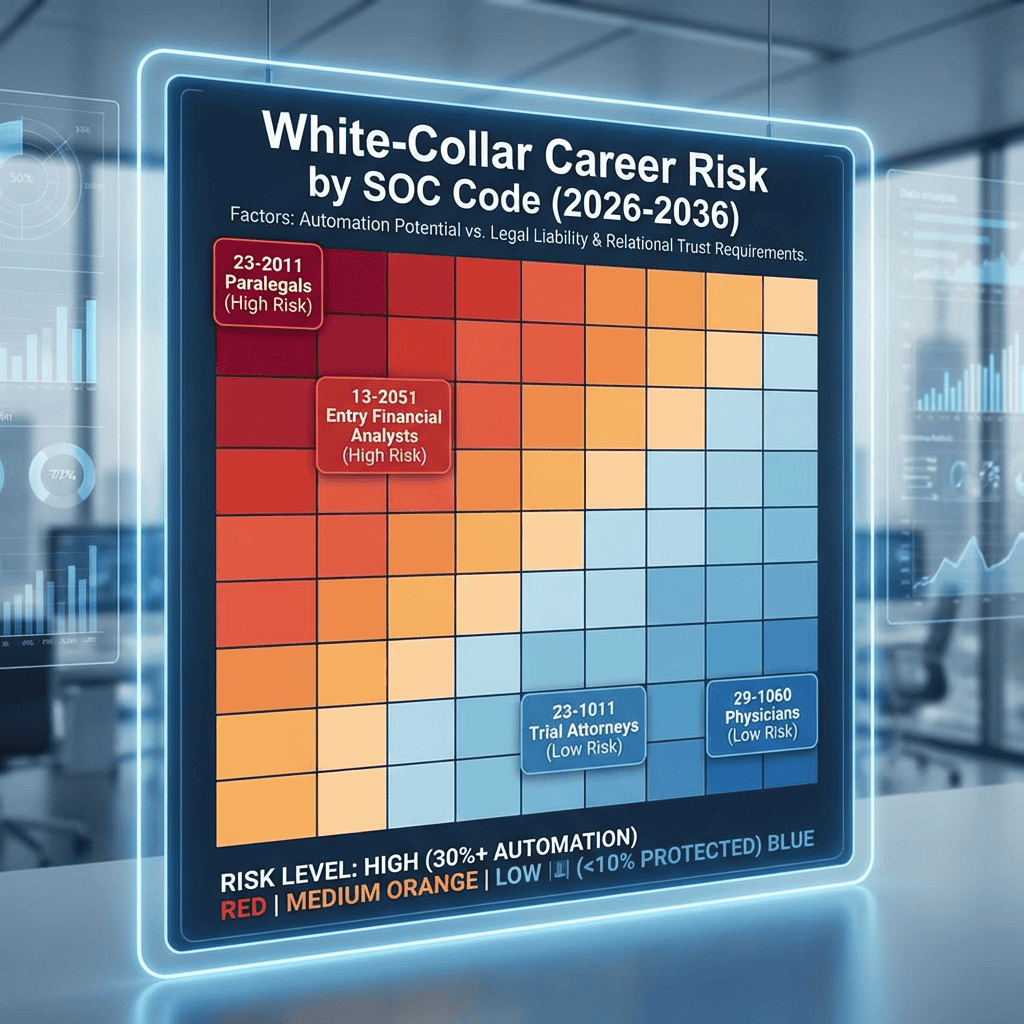
While an aggregate “white-collar wipeout” is unsupported by evidence, primary data from the Stanford Digital Economy Lab and the Dallas Fed confirms a structural collapse of the entry-level hiring funnel for SOC 13, 15, and 23 (Finance, Tech, and Legal) through 2028. This roadmap forecasts the transition from task-level exposure to permanent organizational restructuring over the next decade.
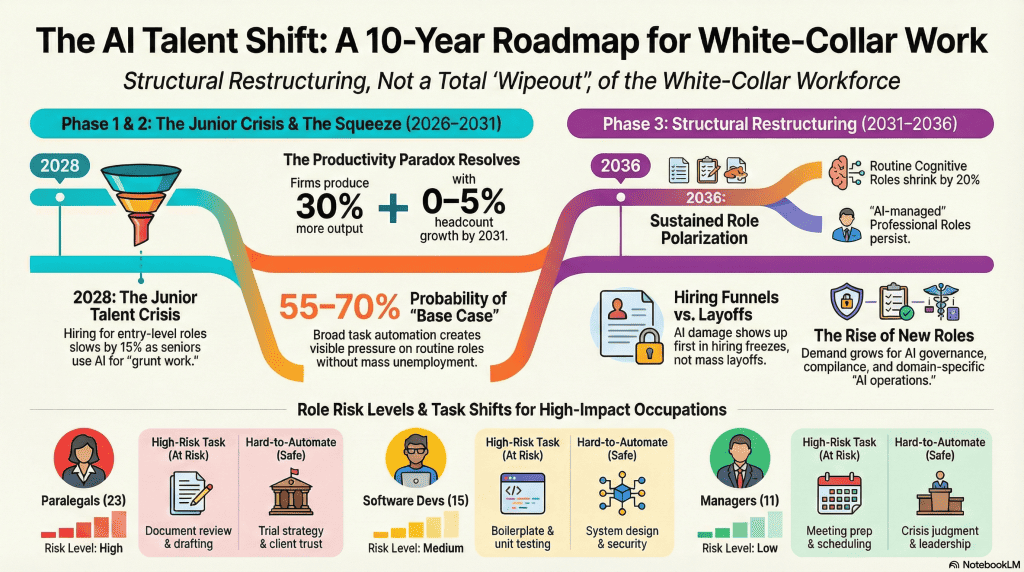
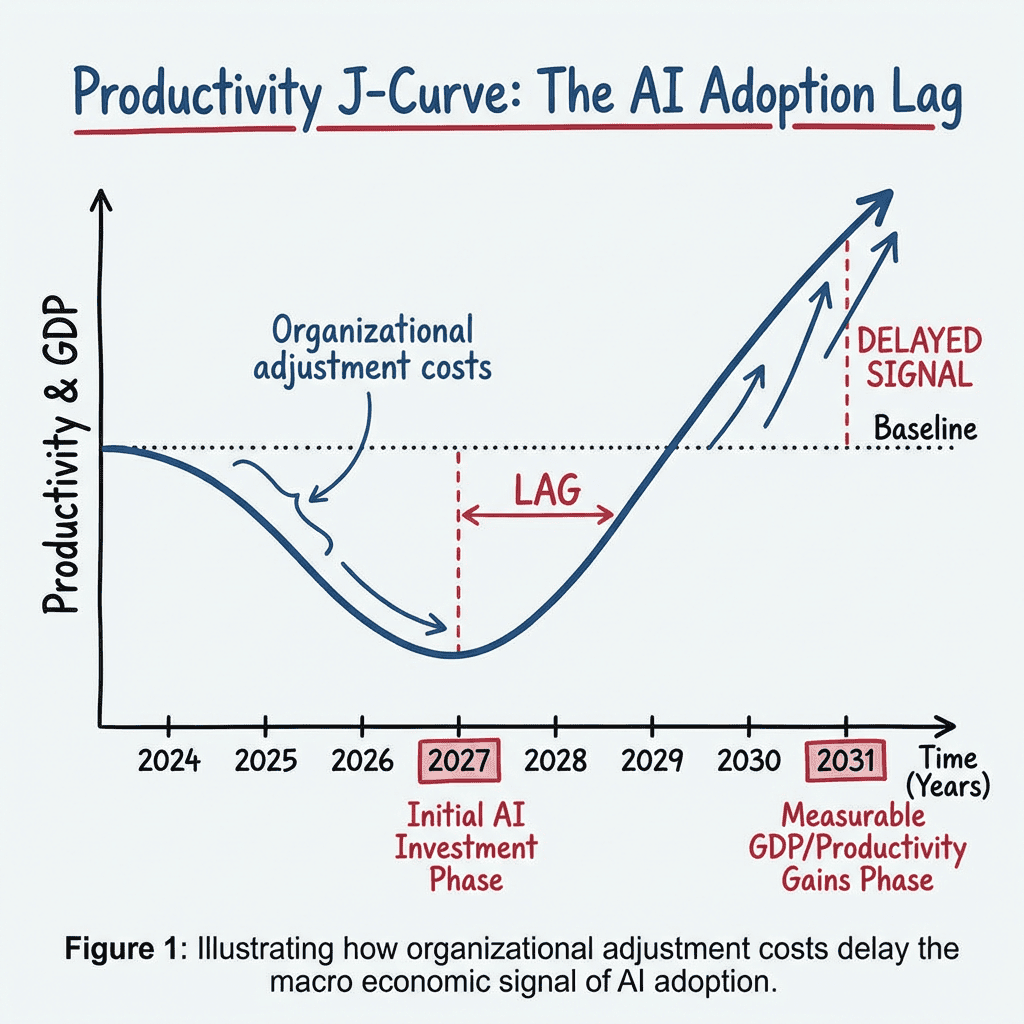
The AI Talent Shift: Phase 1–2 (2026–2031) compress the junior pipeline. Phase 3 (2031–2036) produces sustained role polarization. Source: Analysis based on BLS, Brookings, Stanford ADP Study, Dallas Fed 2026.
Every week a new headline claims AI is about to eliminate white-collar work at scale. Dario Amodei called it a possible “white-collar bloodbath.” Ford’s CEO said AI will “replace literally half of all white-collar workers.” JPMorgan Chase is telling managers to stop hiring.
The hype is running well ahead of the evidence. But the evidence is not reassuring, either — it is just pointing at a different kind of damage than mass layoffs.
What follows is a prognosis built from primary labor data, peer-reviewed research, and three scenario models. The conclusion: AI will not wipe out white-collar employment in any aggregate sense. It will quietly eliminate the entry path into white-collar careers, compress wages for non-augmented workers, and make a smaller number of AI-proficient workers significantly more valuable. The people who get hurt most are 22-to-28-year-olds who are not getting hired, not the senior executives telling you AI is transformative.
What “Wipe Out” Actually Means: Four Displacement Buckets
“Wipe out” is not a single event. It describes four distinct labor displacement mechanisms, each with different timelines and different workers at risk.
Most forecasts collapse these into one alarming number. That is where the hype begins. Separating them is the first requirement for any honest analysis.
| Bucket | Type | What It Means | Current Status |
|---|---|---|---|
| A | Task automation | AI performs a material share of tasks in a role. Headcount unchanged. Scope of work narrows. | Already happening at scale |
| B | Job redesign with productivity lift | Output per worker rises. Jobs persist but change. Headcount stable or modestly reduced. | Dominant dynamic now through 2028 |
| C | Net headcount reduction | Employment level falls within an occupation relative to baseline projections. The role shrinks. | Visible by 2028–2030 in high-exposure roles |
| D | Wage compression and polarization | Middle and entry-tier wages stagnate. AI-augmented workers pull ahead. Role bifurcation widens. | Already measurable in entry-level hiring |
Correction: Task Exposure ≠ Job Elimination
What many sources claim: Studies showing 35–50% of white-collar tasks overlap with AI capabilities mean 35–50% of white-collar jobs will disappear.
Why it persists: Exposure studies are accurate. The interpretation is wrong. A job is a bundle of tasks. Automating 4 of a financial analyst’s 12 tasks is Bucket A, not Bucket C.
The correct reading: The Eloundou et al. studies (2023, 2024) and the W.E. Upjohn Institute (2025) explicitly state that exposure scores measure technical feasibility, not actual displacement or labor market impact.
Therefore: Treat any headline that converts task-exposure percentages directly into job-loss estimates as methodologically unsound. Ask which bucket applies and whether adoption is confirmed, not merely possible.
Where We Stand in 2026: The Baseline Before Hype
As of early 2026, AI is measurably reshaping white-collar hiring pipelines, but aggregate employment data has not yet turned negative.
Here is what the primary data actually shows:
- Fewer than 10% of U.S. firms used AI regularly as of mid-2025, rising to just over 20% in professional, scientific, and technical sectors. (J.P. Morgan Global Research, 2025)
- The unemployment rate for college graduates has risen above the aggregate rate, with AI-exposed majors — computer engineering, design, architecture — among those most affected. (J.P. Morgan Global Research, 2025)
- Cloud computing, web search, and computer systems design stopped adding jobs at the end of 2022 — the month ChatGPT launched. (J.P. Morgan Global Research, 2025)
- 40% of white-collar job seekers in 2024 failed to secure a single interview. (American Staffing Association, cited in industry analysis)
- AI-attributed layoffs totaled roughly 55,000 of 1.17 million total U.S. layoffs in 2025 — about 4.7% of all layoffs. (Challenger, Gray & Christmas, 2025, via AI Multiple)
- Employment declines for early-career workers in software development and customer support are already measurable in ADP administrative data. (Stanford Digital Economy Lab, 2025)
The macro signal looks calm. The disaggregated signal by age, occupation, and experience level is not.
Evidence Anchor: Returns to Experience Rising in AI-Exposed Roles
Dallas Fed analysis (January and February 2026) finds young workers are losing employment share in AI-exposed occupations while returns to experience are rising. This is the structural pattern that explains both facts simultaneously: seniors use AI to absorb work that previously required junior headcount, while juniors have fewer positions into which to enter. Sources: Dallas Fed, Jan 2026 and Dallas Fed, Feb 2026.
Three Scenarios, Probability-Weighted Through 2031
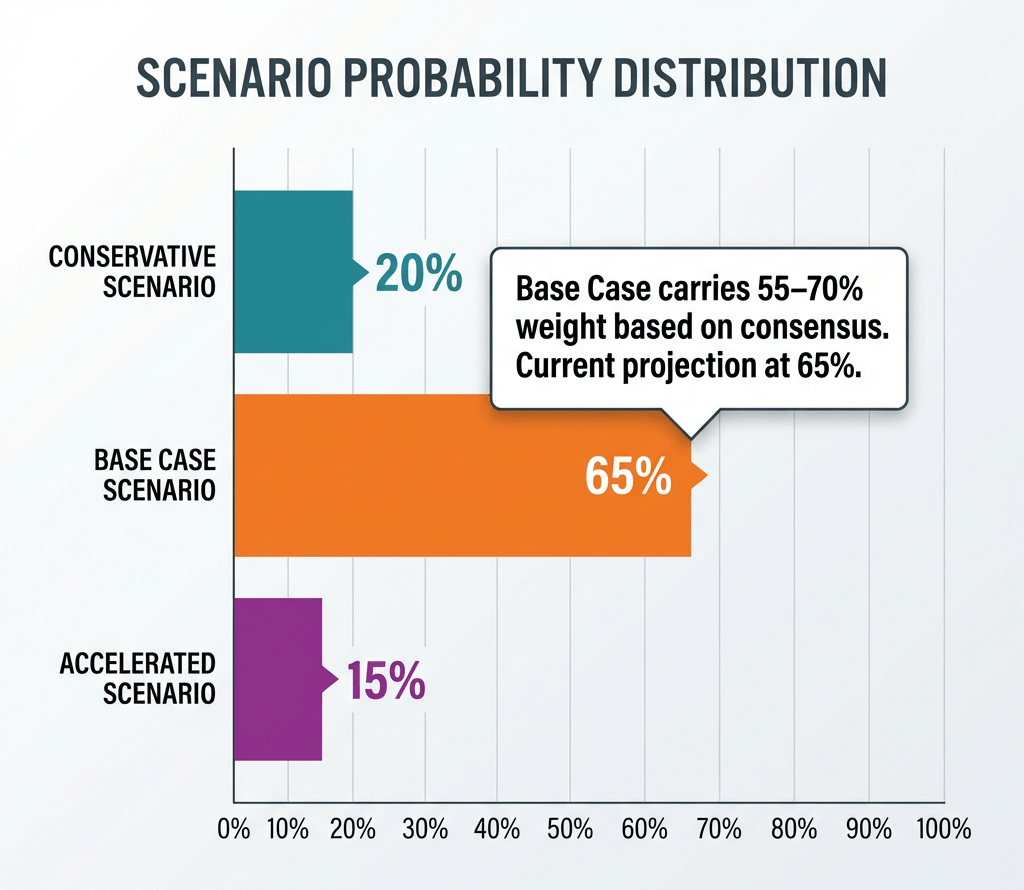
Three AI adoption scenarios cover the credible range of outcomes. Their probability weights must sum to 100% to be useful.
Independent analyses from our evidence base — Brookings, Stanford, Yale Budget Lab, Dallas Fed, J.P. Morgan — converge on roughly the same scenario distribution. What follows reflects that consensus with explicit assumptions and break points.